Nightingale’s CoreMetabolomics expands: broader metabolic coverage with 20 new biomarkers and an Lp(a) prediction score
Solution spotlight Oct 15, 2026

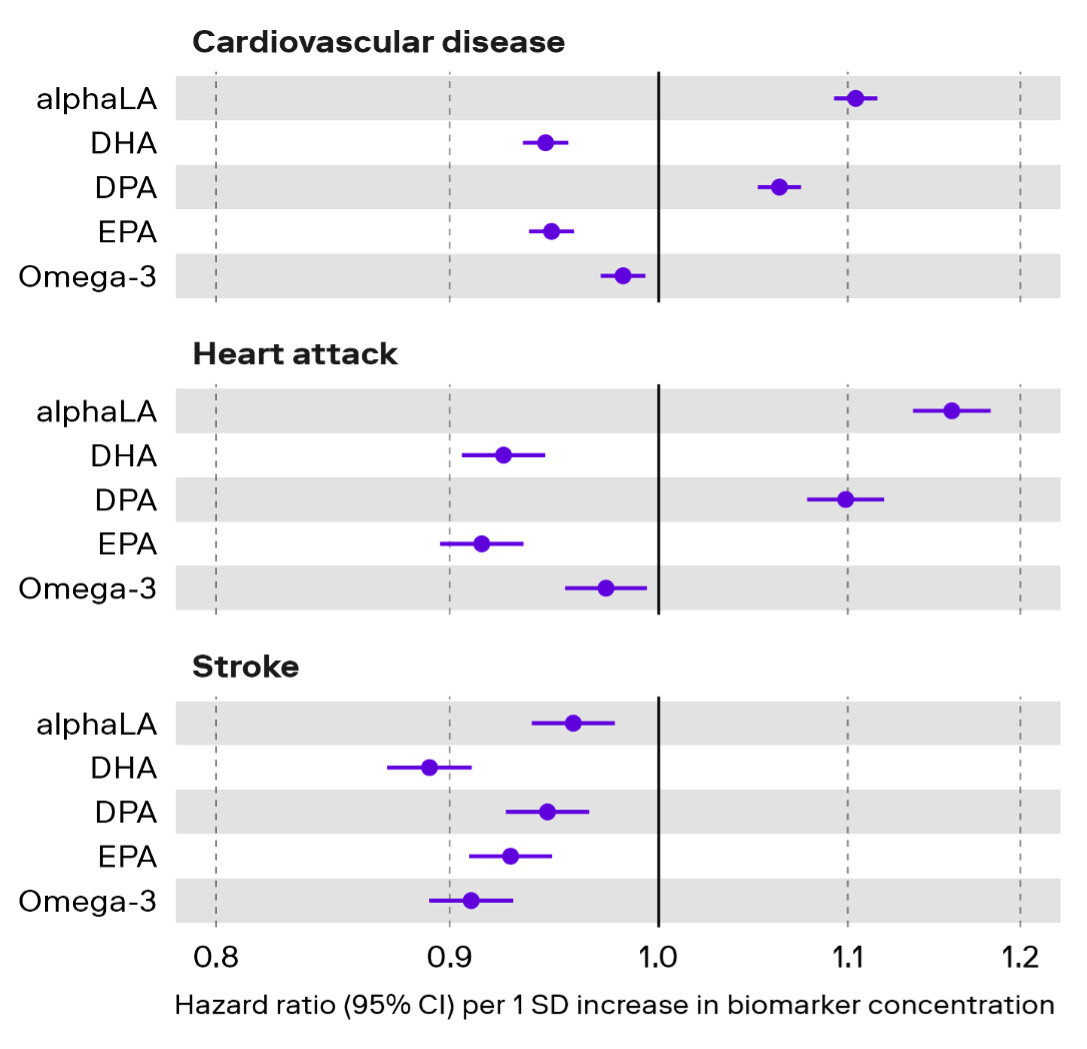
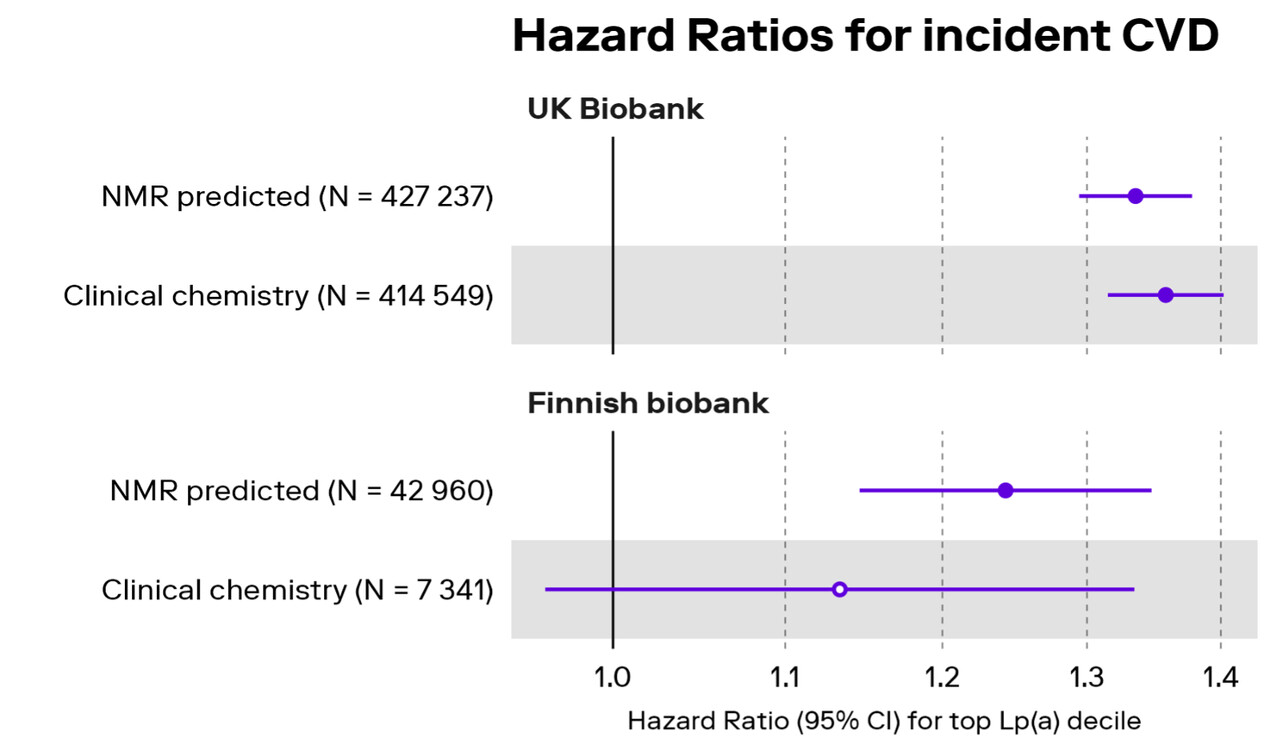
Omega-3 fatty acids are widely assumed to be protective of cardiovascular health, but do they all behave the same way? How can we identify individuals at high risk of cardiovascular disease due to high lipoprotein(a)?
These are examples of questions that large-scale metabolomics can help researchers investigate. CoreMetabolomics uses NMR spectroscopy to quantify a broad range of circulating biomarkers from a single blood sample, providing researchers with a detailed view of metabolic health and disease-related biology.
The 250-biomarker panel already captures multiple layers of metabolism, including lipoproteins and lipids, fatty acids, amino acids and other metabolic measures. The expansion builds on this foundation, adding greater depth in areas where more detailed molecular information can open up new research questions.
The expansion adds 20 biomarkers: six polar metabolites, reported as absolute concentrations, and seven fatty acids, reported as absolute concentrations and as ratios to total fatty acids, alongside a prediction score for lipoprotein(a), an important cardiovascular risk factor. Researchers will now receive 269 biomarkers from plasma or 270 from serum, together with the Lp(a) prediction score.
The new polar metabolites broaden coverage of amino acids and intermediate metabolism, while the new fatty acid measures add considerably more detail to a part of the panel that already quantifies total fatty acids, saturated, monounsaturated and polyunsaturated fatty acids, omega-3 and omega-6 fatty acids, and linoleic acid. Together, these additions expand the range of biology that can be captured with NMR spectroscopy, from mitochondrial and kidney metabolism to fatty acid subtypes and inherited cardiovascular risk.
Here, we provide an overview of the new biomarkers and preliminary results observed when quantifying them in UK Biobank (UKB).
Six new polar metabolites
- Glutamic acid is an amino acid at the crossroads of nitrogen and energy metabolism, and the main excitatory neurotransmitter in the brain;
- Lysine is an essential amino acid that must come from the diet. It is needed for collagen cross-linking and for the synthesis of carnitine, which carries fatty acids into mitochondria for oxidation;
- Serine is an amino acid that supplies one-carbon units for nucleotide synthesis and is a precursor of glycine and sphingolipids;
- Succinate is an intermediate of the citric acid cycle in the mitochondria, with emerging roles in inflammation and cancer biology;
- Myo-inositol is a cyclic sugar alcohol, abundant in the kidney, where it is reabsorbed and broken down, and previously proposed as a marker of kidney function;
- 1,2-propanediol is a compound largely of dietary or environmental origin and is also produced by gut bacteria when they ferment dietary sugars. Its plasma levels have been linked to alcohol use and alcoholic liver disease.
One advantage of adding these molecules to an already broad metabolomic panel is that they can be analysed in the context of many other circulating biomarkers, as well as other layers of biological data. When combined with genetics, metabolomics helps explain how metabolism is regulated, as shown by the recent biobank analysis of the current panel from colleagues at the University of Tartu (Tambets et al., 2026). These new metabolites extend that approach. We performed genome-wide association studies (GWAS) for each of the new polar metabolites and found a total of 274 independent loci across them, most of them (165) unique to each metabolite, and lying near genes involved in the metabolite’s own transport or processing.
For myo-inositol, for example, the strongest signals sit at SLC5A11, which encodes a sodium-dependent myo-inositol transporter, and ISYNA1, which encodes the enzyme that triggers the first step of myo-inositol biosynthesis. For glutamic acid, they sit at SLC1A3 (a high-affinity transporter), GLS2 (an enzyme converting glutamine to glutamic acid) and PRODH (which starts the breakdown of proline into glutamic acid).
The strongest single GWAS association was for 1,2-propanediol. It showed a peak near HSD17B13, a known liver cirrhosis locus (β=0.15, P=1.3×10⁻³⁰⁴). It was also associated with alcoholic liver disease (OR=1.25 per SD) and alcohol use disorder (OR=1.22 per SD) in UKB data, supporting results from the 1980s (Casazza et al., 1987).
What glutamic acid adds to disease prediction
Glutamic acid stands out for its associations across diseases. Higher levels were associated with a higher risk of incident disease across various endpoints (Figure 1). Importantly, its predictive value is complementary to information already captured by the existing panel: associations remained significant when added on top of our previously developed metabolomic scores (Nightingale Health Biobank Collaborative Group, 2024).
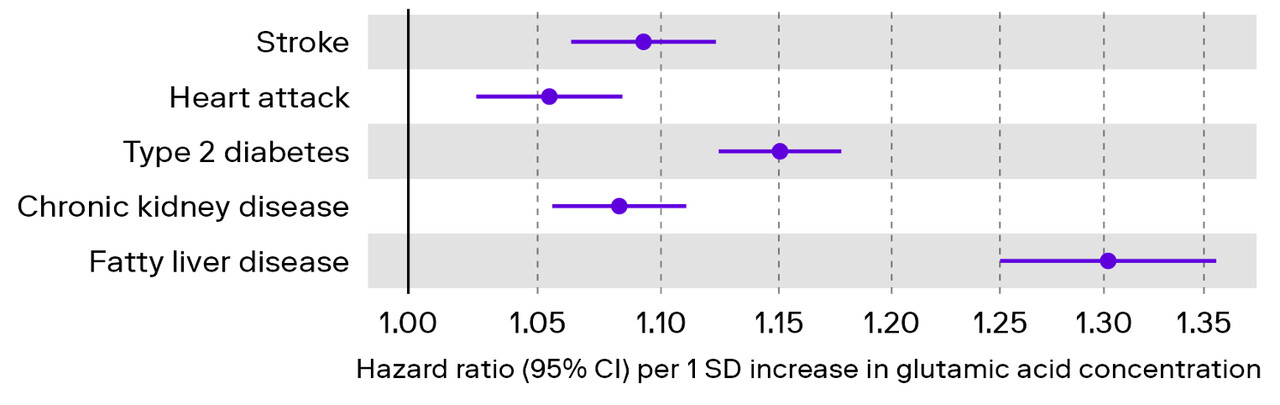
Figure 1: association between glutamic acid levels and 10-year incidence of stroke (nincident = 4750), heart attack (nincident = 4897), type 2 diabetes (nincident = 6248), chronic kidney disease (nincident = 5408), and fatty liver disease (nincident = 1763), adjusted for age, sex, and disease-specific metabolomic scores.
Genetic analyses also point towards how systemic levels of glutamic acid might reflect its major role as a neurotransmitter. A missense variant in SLC39A8 (rs13107325) is associated with a higher risk of schizophrenia and multiple sclerosis and lower risk of Parkinson’s disease. In our analyses, this same variant was strongly associated with lower glutamic acid levels, and earlier work suggests that the variant reduces zinc-dependent expression of neuronal glutamate receptors (Tseng et al., 2021). This suggests that we may be seeing a mirroring of systemic and organ-specific genetic effects on glutamate between the blood and the brain.
Seven new fatty acid subtypes
CoreMetabolomics already provides a broad fatty acid profile, covering saturated, monounsaturated and polyunsaturated fatty acids as classes, omega-3 and omega-6 fatty acids, and one subtype for each of the latter (docosahexaenoic acid and linoleic acid, respectively). The expansion takes this established fatty acid profiling a level deeper, adding subtypes to each of the unsaturated branches of the tree (Figure 2):
- Omega-3: alpha-linolenic, eicosapentaenoic, and docosapentaenoic acid
- Omega-6: arachidonic acid
- Monounsaturated: omega-5, omega-7 and omega-9
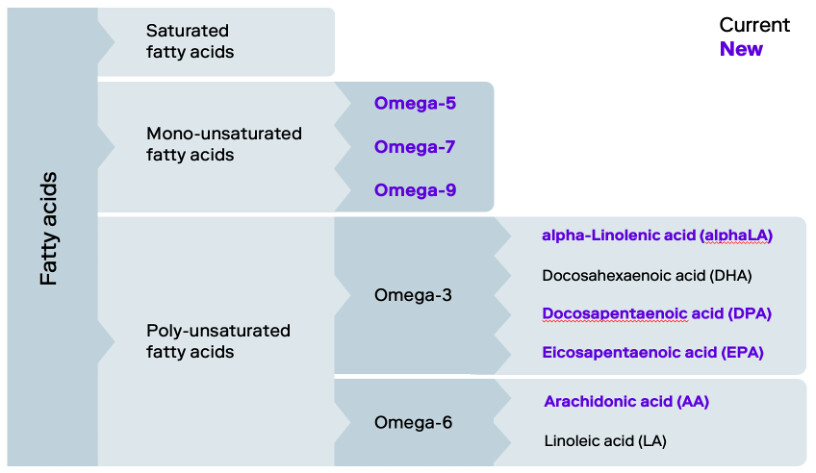
Figure 1: tree representation of current and new fatty acids included in our CoreMetabolomics panel